Management Reporting in Project Management
Management reporting is the primary source of information for all managers, stakeholders and decision-makers and therefore an essential success factor for every company. Naturally, digitization has also become an integral part of management reporting. Furthermore, communicating project information effectively has become a must-have skill that every project professional needs to have. When it comes to passing on important project information to your management, visualizations support this significantly.
What is the Timeline Gantt Chart?
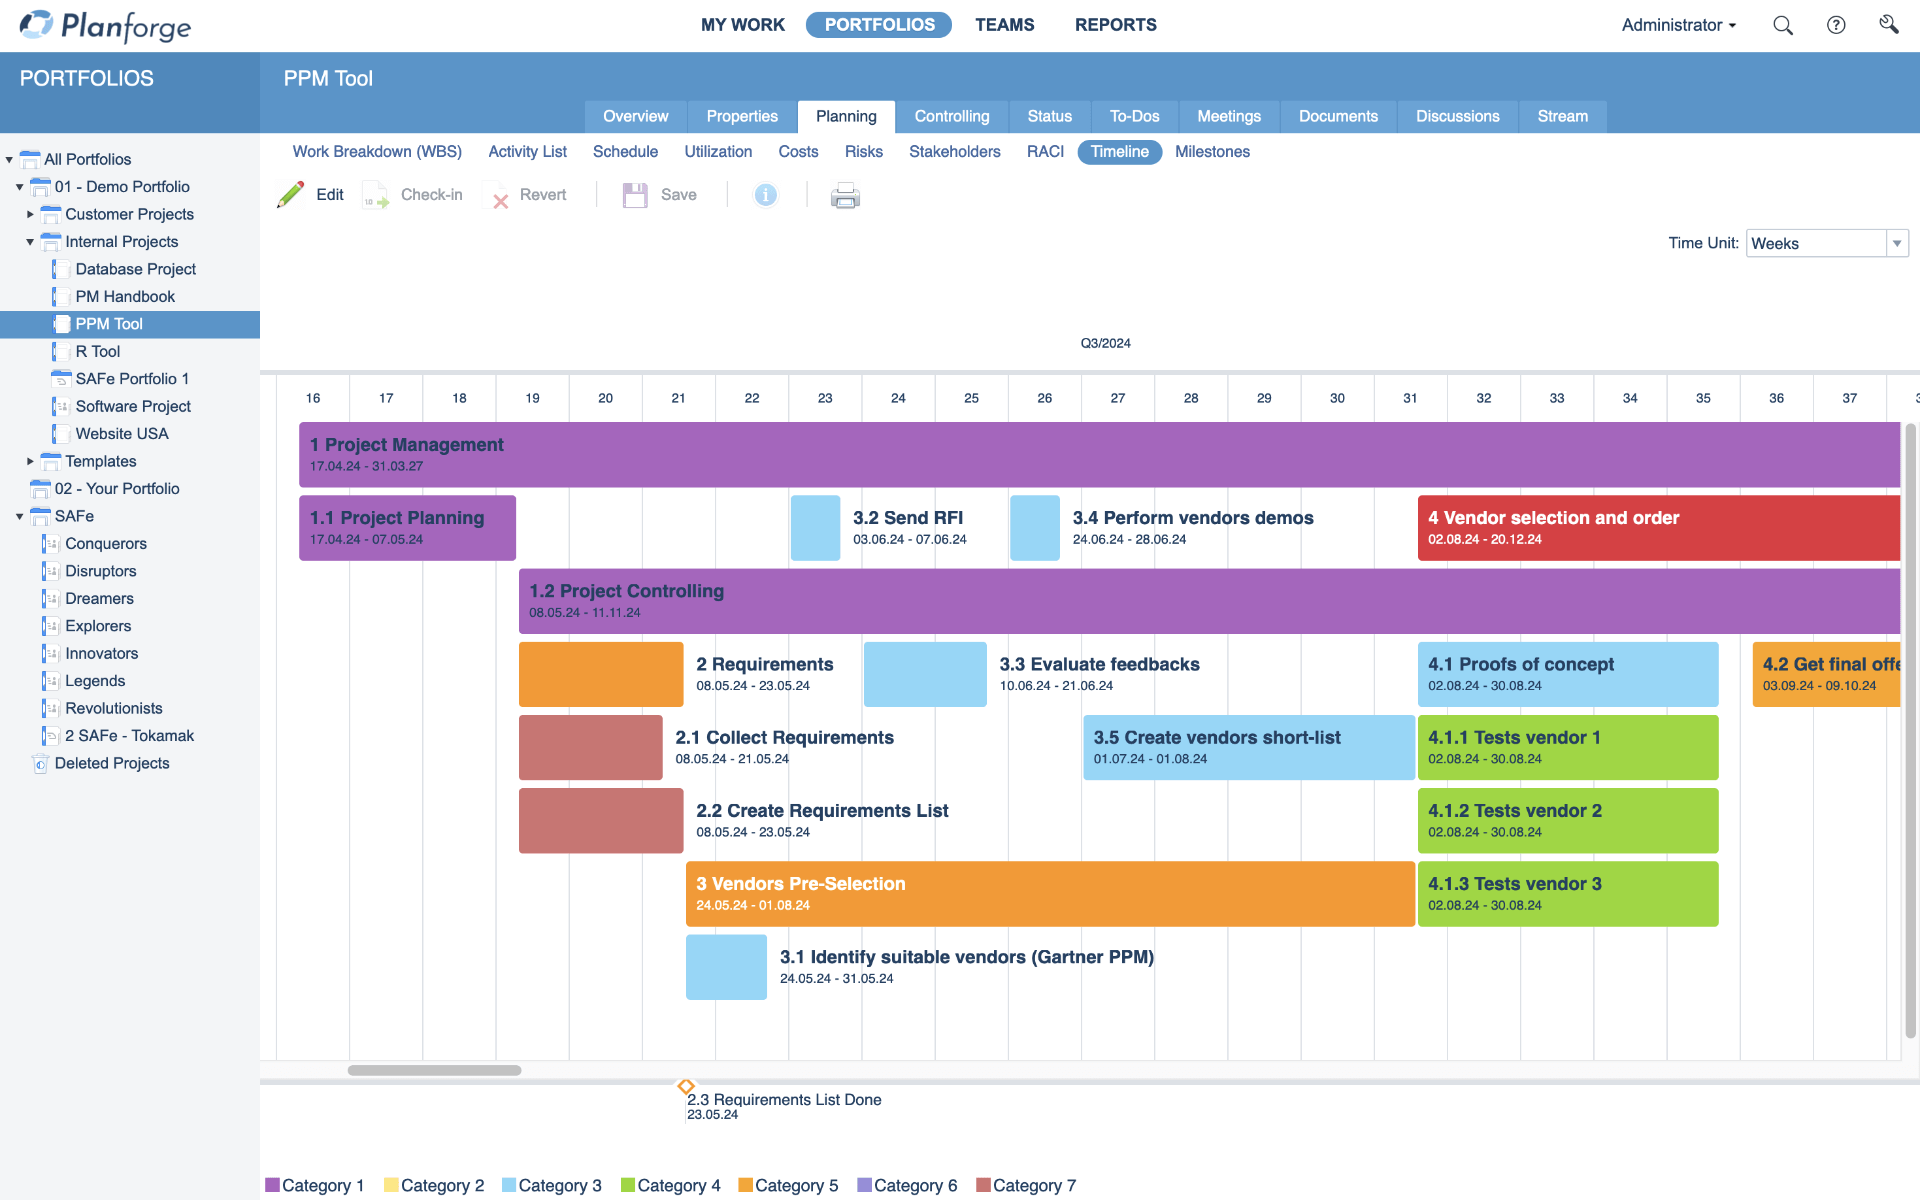
Timelines are like summarized Gantt Charts, with only the most important dates, milestones, work packages and phases shown.
The power in creating a timeline for reports is that you have more control over the data and can display only what you deem most important. It’s not so easy to filter your Gantt Chart in the same way.
Problems at Project Status Meetings
During project status meetings, every manager or stakeholder will ask the number 1 question:
”Are we on track to meet our deadline(s)?”.
Showing dates and facts is essential to answer this.
Think back to the last project status report you have created or interacted with:
- Did it have any visual elements?
- Could you get a clear indication of how the project was progressing?
- Were there colors used or just black text?
- Was it easy to understand?
Article: How to run project status meetings
How visualizations can facilitate meetings
Of course, it is possible to copy and paste a Gantt Chart into the report or presentation. But these charts can be quite complex and somehow confusing for your management or stakeholders.
And as the trend toward conveying information visually continues nowadays, there are great tools to help you visually report your project progress and dates on a custom timeline. And some tools make it even possible to show it live.
 The Timeline Gantt Chart in Planforge
Imagine a project report or presentation with a great timeline that highlights scheduled activities and completed and upcoming milestones in full color!
Adopting a visual method of presenting data to others will make it easier to bring forth detailed data and project information in an organized way. And your management and stakeholders will be pleased to get a comprehensive overview.
With a Timeline live management reporting is facilitated by visualizing selected phases, work packages and milestones at a glance.


 Jira
Jira
 Confluence
 SAP
SAP
 API
API


