Table of content
- What is the Earned Value Analysis of a project?
- How to calculate the Earned Value?
- How to calculate the cost efficiency on the respective key date?
- How to calculate the time efficiency at the respective deadline?
- A practical example of the Earned Value Calculation
- The Earned Value Diagram simply explained
- Interpretation of the Diagram
- Limits of the Earned Value Method
1. What is the Earned Value Analysis of a project?
The Earned Value Analysis evaluates the progress of a project at a given point in time. It is literally the value that you've earned at day XY. This value always concerns the planned goal of your project.
This analysis calculates a project's planned and actual state by a specific date. This way, you can determine time arrears or budget overruns.
2. How to calculate the Earned Value
There is a simple way to calculate the Earned Value (EV):
The basic calculation formula multiplies the Planned Value (PV) by the project's percentage of completion (%) at a given time.
The Earned Value Formula:
EV = PV x %
EV: Earned Value
PV: Planned Value (on a specific date)
%: Percentage of completion
- The Planned Value can represent both costs and efforts.
- The total planned costs or efforts for the project or activity are used.
- The percentage of completion variable is given as a percentage. This variable can be calculated or taken from a project management software and indicates how far a task has been completed.
3. How to calculate the cost efficiency on the respective key date
With the help of the Earned Value you can now calculate other variables. Cost efficiency is an essential indicator of the status of your project. This calculation concerns the costs, considering the time efficiency.
The cost efficiency formula:
CPI = EV / AC
CPI: Cost Efficiency
EV: Earned Value (on a specific date)
AC: Actual Costs or Actual Effort
CPI < 1: negative: the cost situation is not according to plan. The project is over budget.
CPI > 1: positive: So far, the project is running more favorably than planned.
CPI = 1: equal: You are working precisely according to plan.
4. How to calculate the time efficiency at the respective deadline
Time efficiency is the schedule performance index of your project. It gives you information about the current schedule situation.
The time efficiency formula:
SPI = EV / PV
SPI: Time Efficiency (Schedule performance index)
EV: Earned Value
PV: Planned Value
SPI < 1: negative: The schedule situation is not according to plan.
SPI > 1: positive: More has already been accomplished than planned.
SPI = 1: equal: You are working precisely according to plan.
Note:
If the CPI is less than 1, but SPI is larger than 1, you are over budget, but you have also already completed more than planned. Such examples show the importance of comparing key figures and interpreting them correctly.
5. A practical example of the Earned Value Calculation
Three months after starting a large project, you want to compare the actual state of a partially executed activity with your plan. Your project management software shows that this activity is 25% completed. This activity's total planned effort (PV) is 80 person days.
Step 1: Calculate the Earned Value
So, the Earned Value of this activity at this point is:
EV = PV x %
EV = 20
Subsequently, you can calculate the total Earned Value of all activities: You have eight activities for this project. Now you want to calculate all the completion values of these activities and the Earned Value for the whole project: Repeat the previous step for all activities and sum up the results.
EV total = EV1 (20) + EV2 + EV3 + EV4 + EV5 + EV6 + EV7 + EV8.
Step 2: Calculate the cost efficiency
Let's assume you have now calculated the EV with costs as Planned Value. The EV total in terms of project costs is 2,000€. The actual cost as of the reporting date is 2,300€.
CPI = EV / AC
CPI < 1 means you are over the planned budget.
Step 3: Calculate the time efficiency at the respective deadline
If a project's Earned Value is 100 and the Planned Value is 120 person days, then the SPI is 0.83.
This means that the project is behind schedule by 20 person days.
If a project's Earned Value is 100 and the Planned Value is 80 person days, then the SPI is 1.25. This means that the project is ahead of schedule by 20 person days.
SPI = EV / PV
SPI = 100/80 = 1.25
6. The Earned Value Diagram simply explained
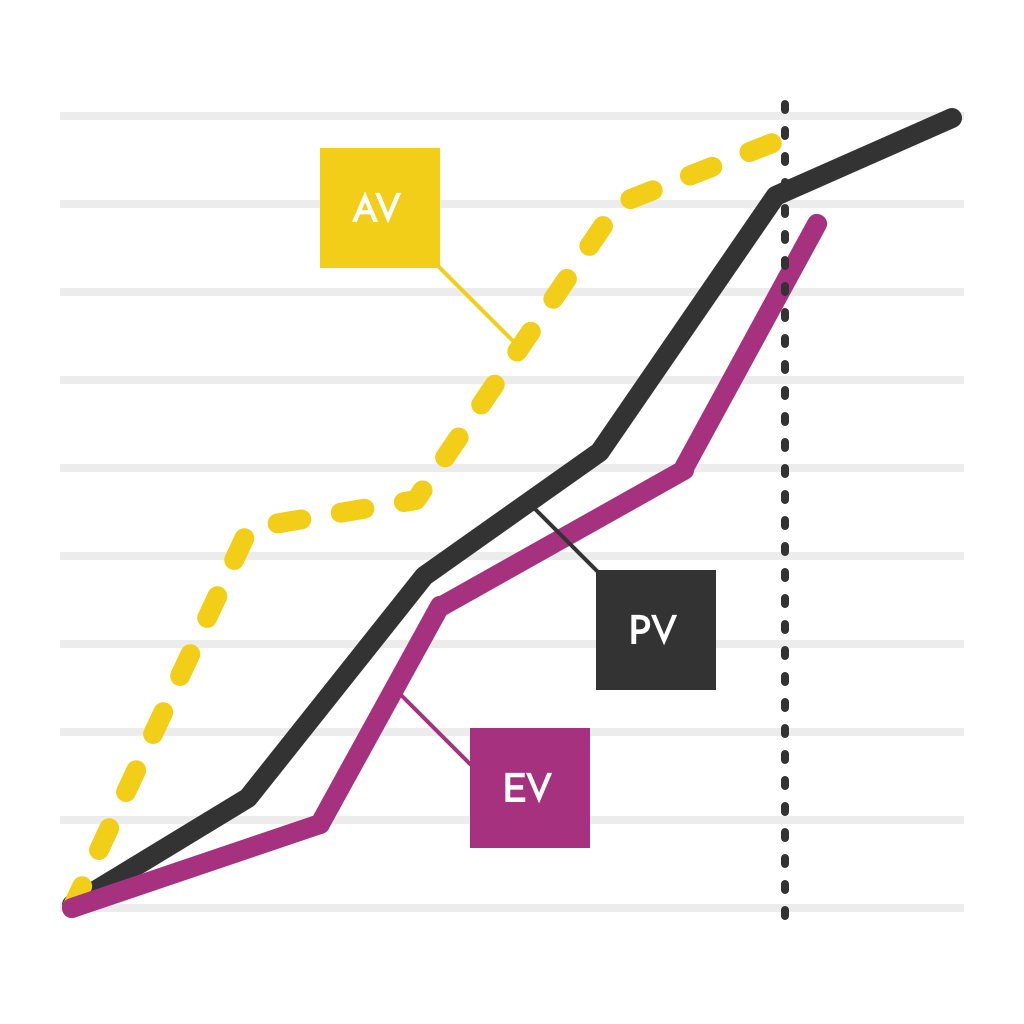
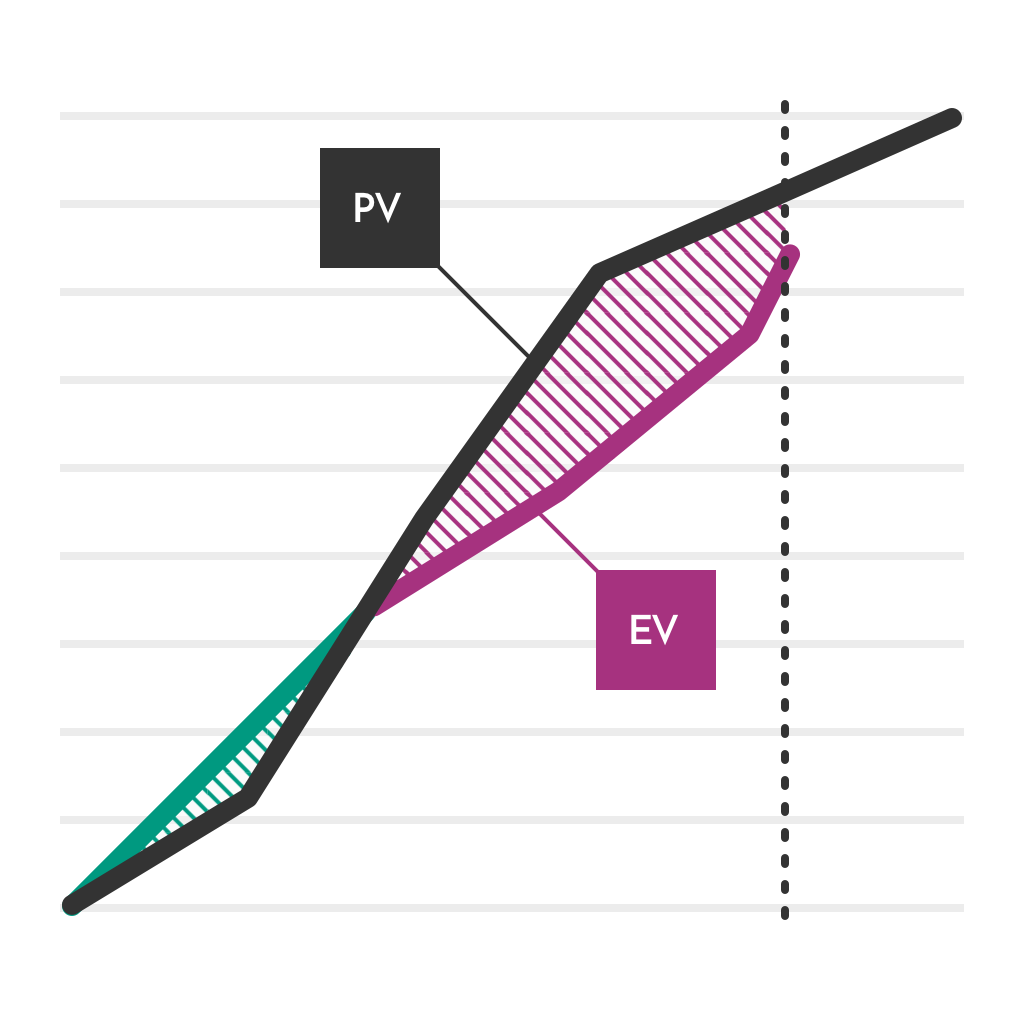
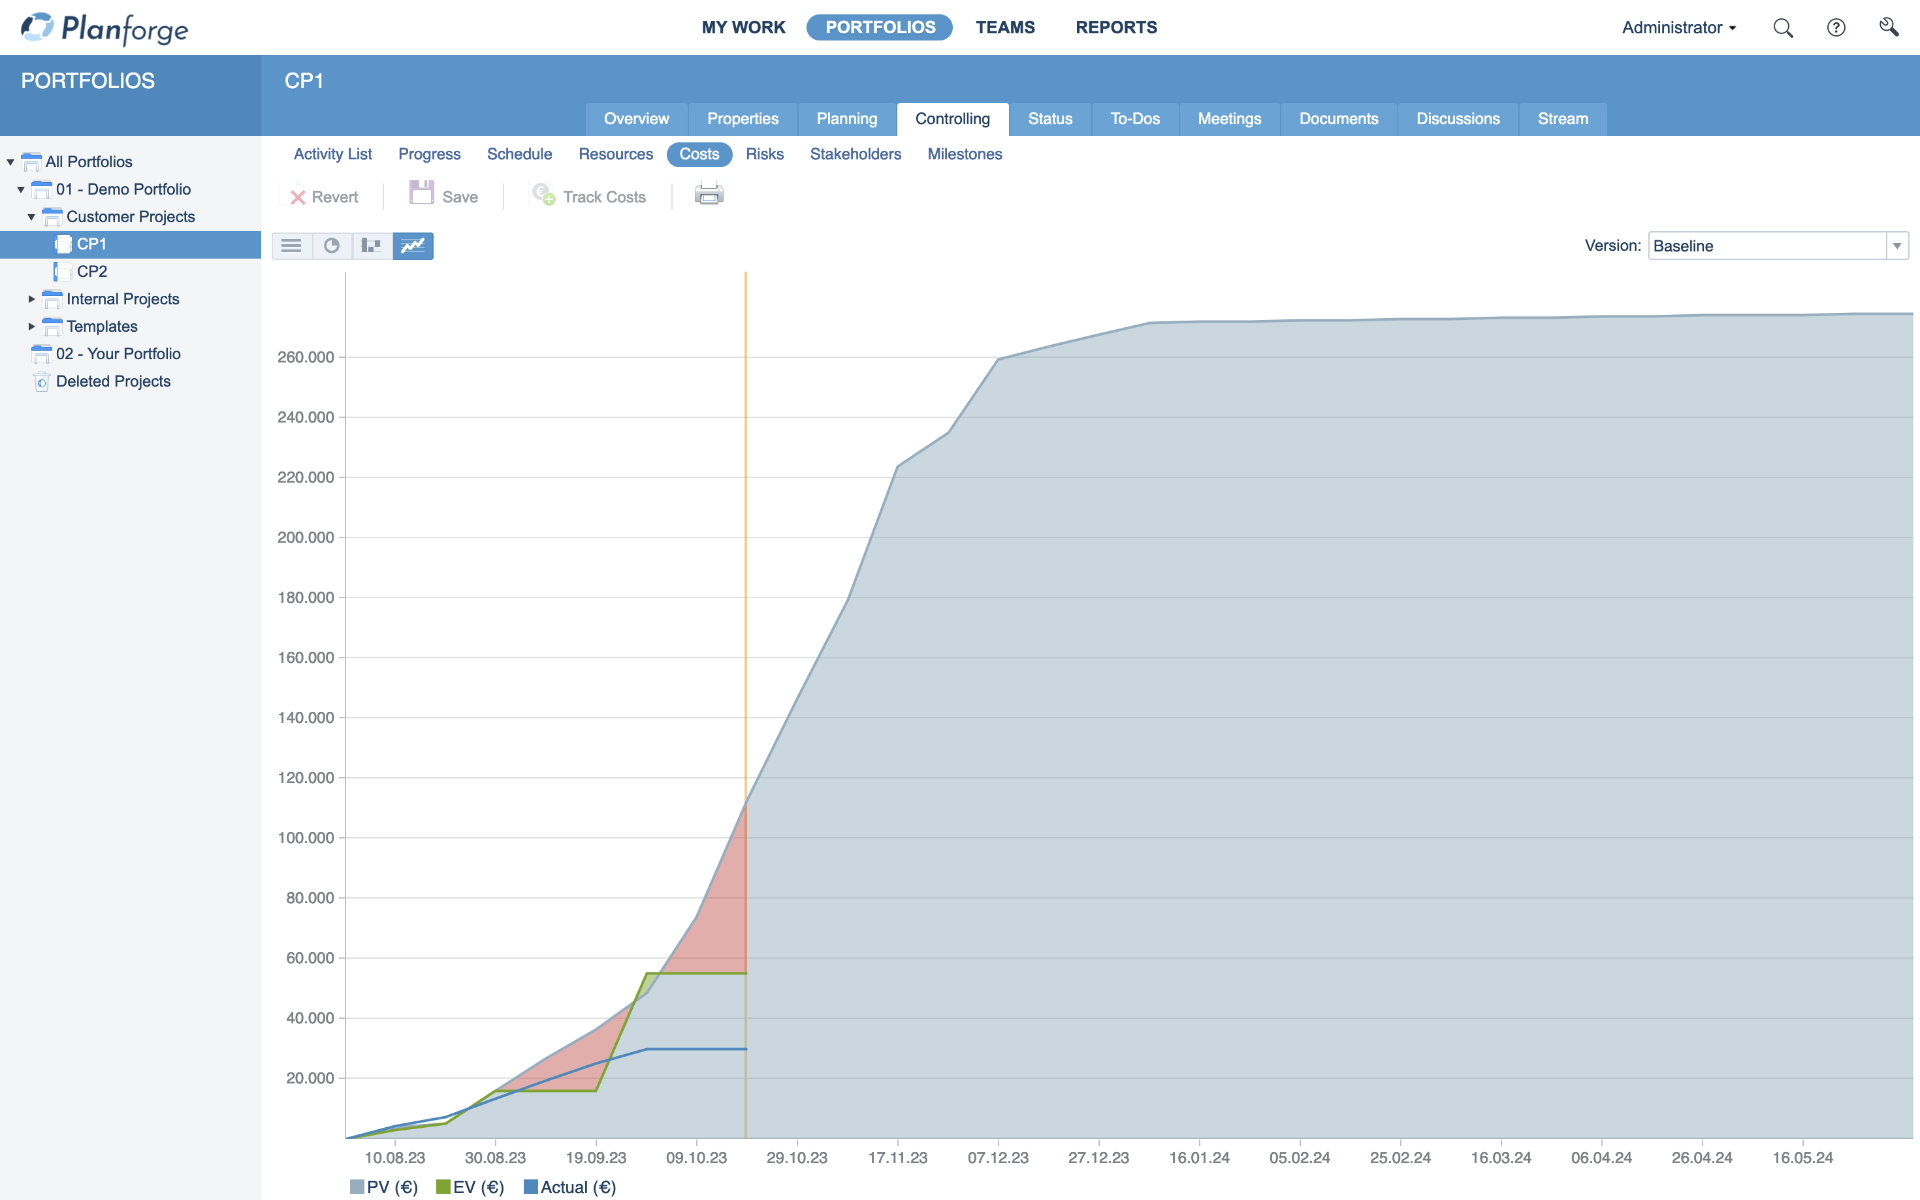
Now let's focus on the EV diagram for a simple, practical explanation. It contains three lines: Planned Value (PV), Earned Value (EV), and Actual Value (AV).
- Planned Value (PV) shows the cumulative value of the planned work over a certain period (costs or effort)
- Earned Value (EV) shows the cumulative value of the planned work that has already been completed over time (costs or effort).
- Actual Value (AV) shows the accumulated value of the actual costs incurred or costs at a given time.
Note:
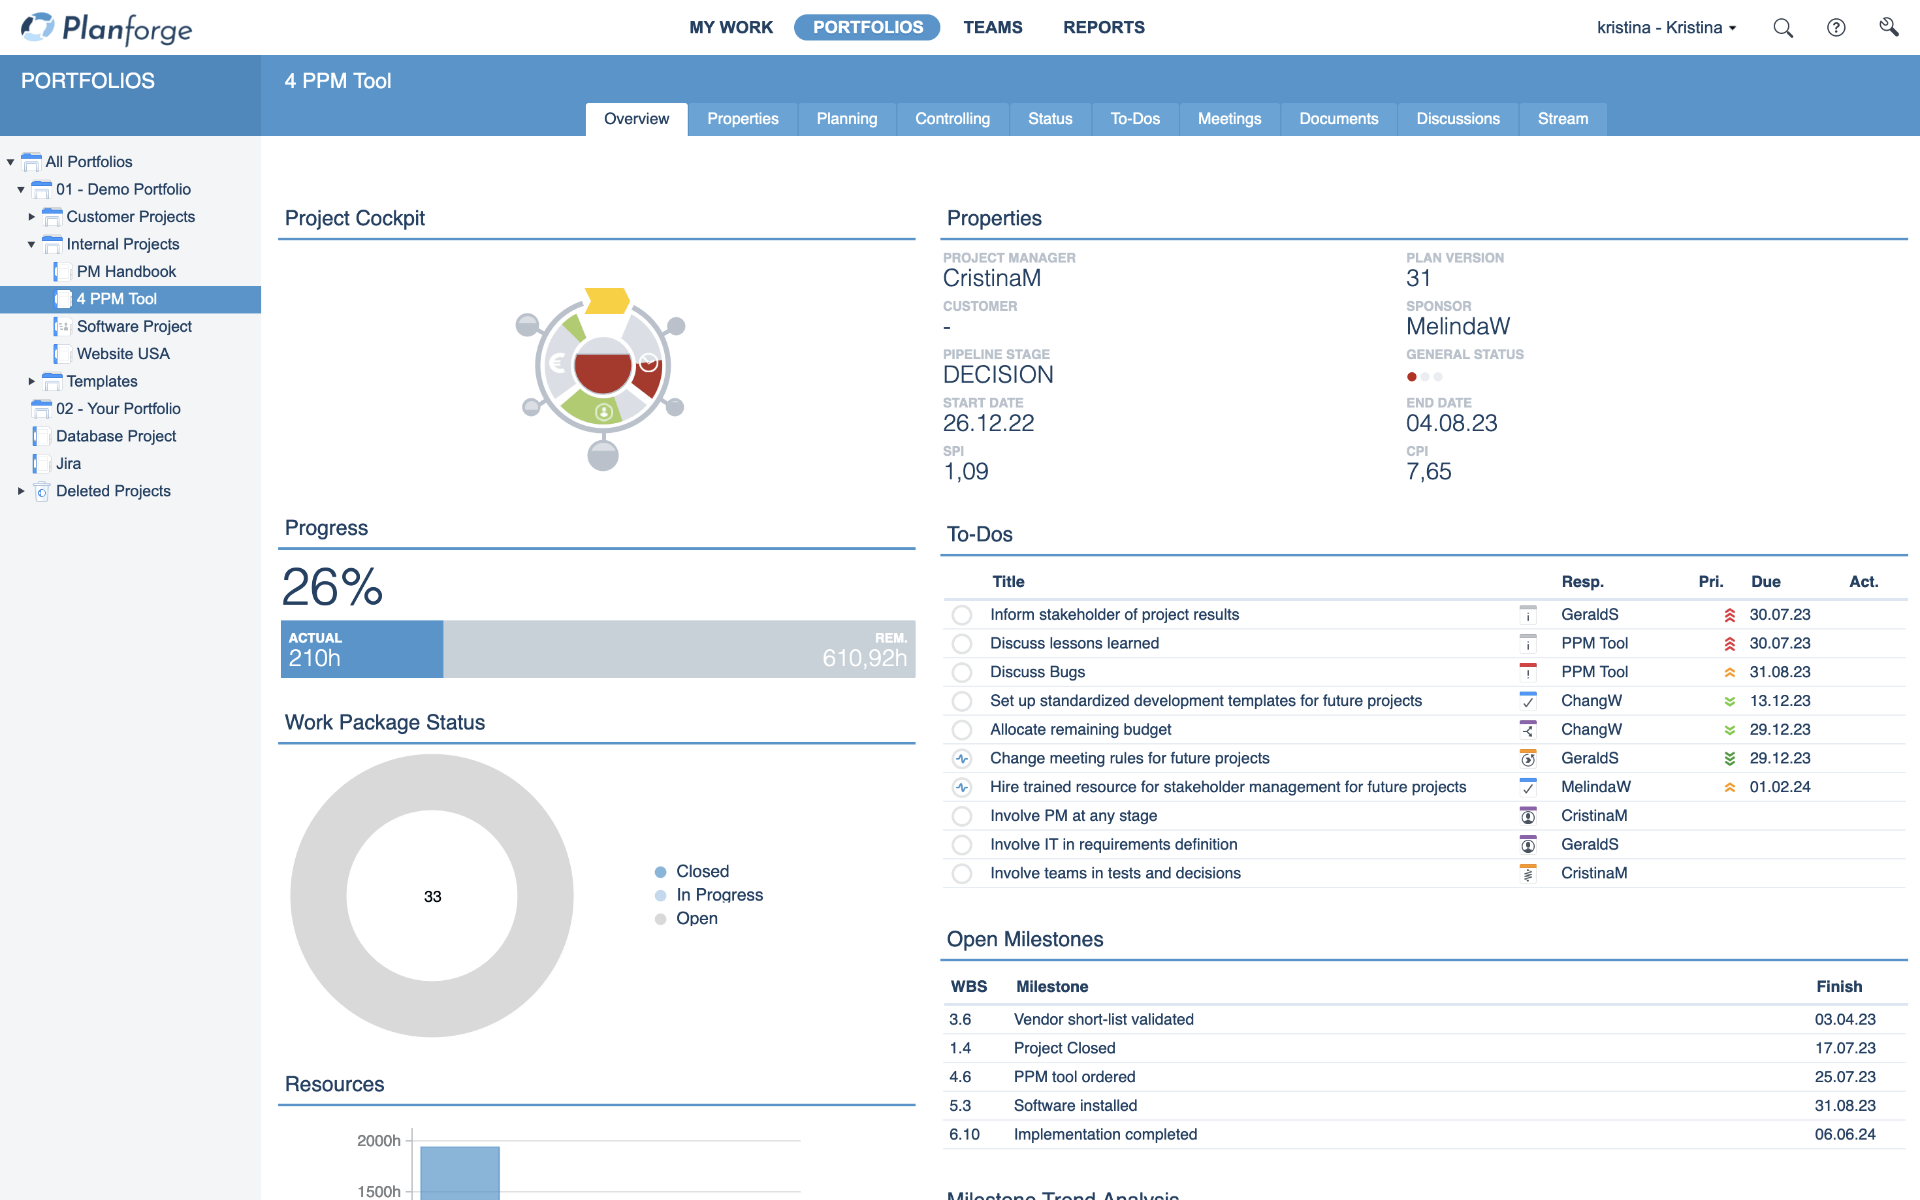
The Actual Value requires further calculation and is included in many PM tools. In these tools, project progress, Earned Value, and other controlling key figures can be analyzed in seconds, as you can see above.
7. Interpretation of the diagram
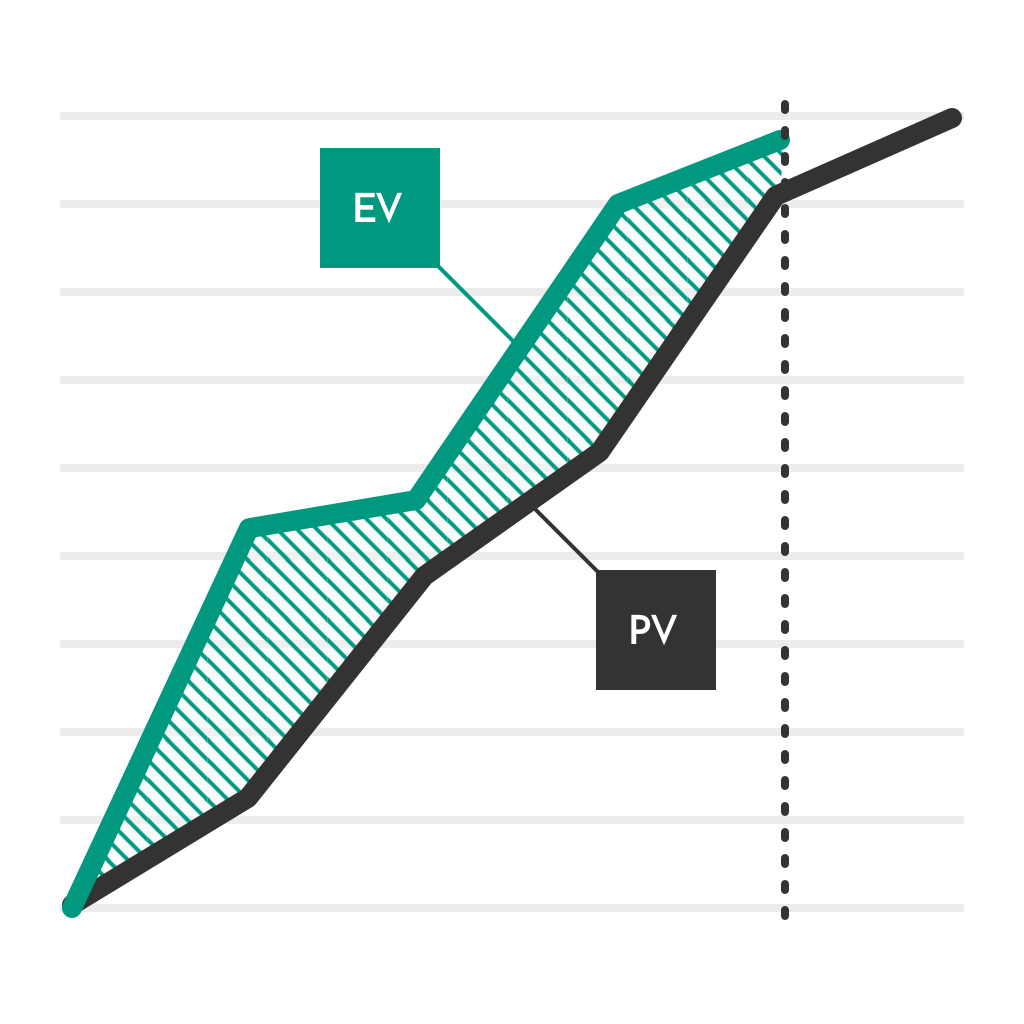
EV above PV: On schedule or better
EV below PV: Not on schedule
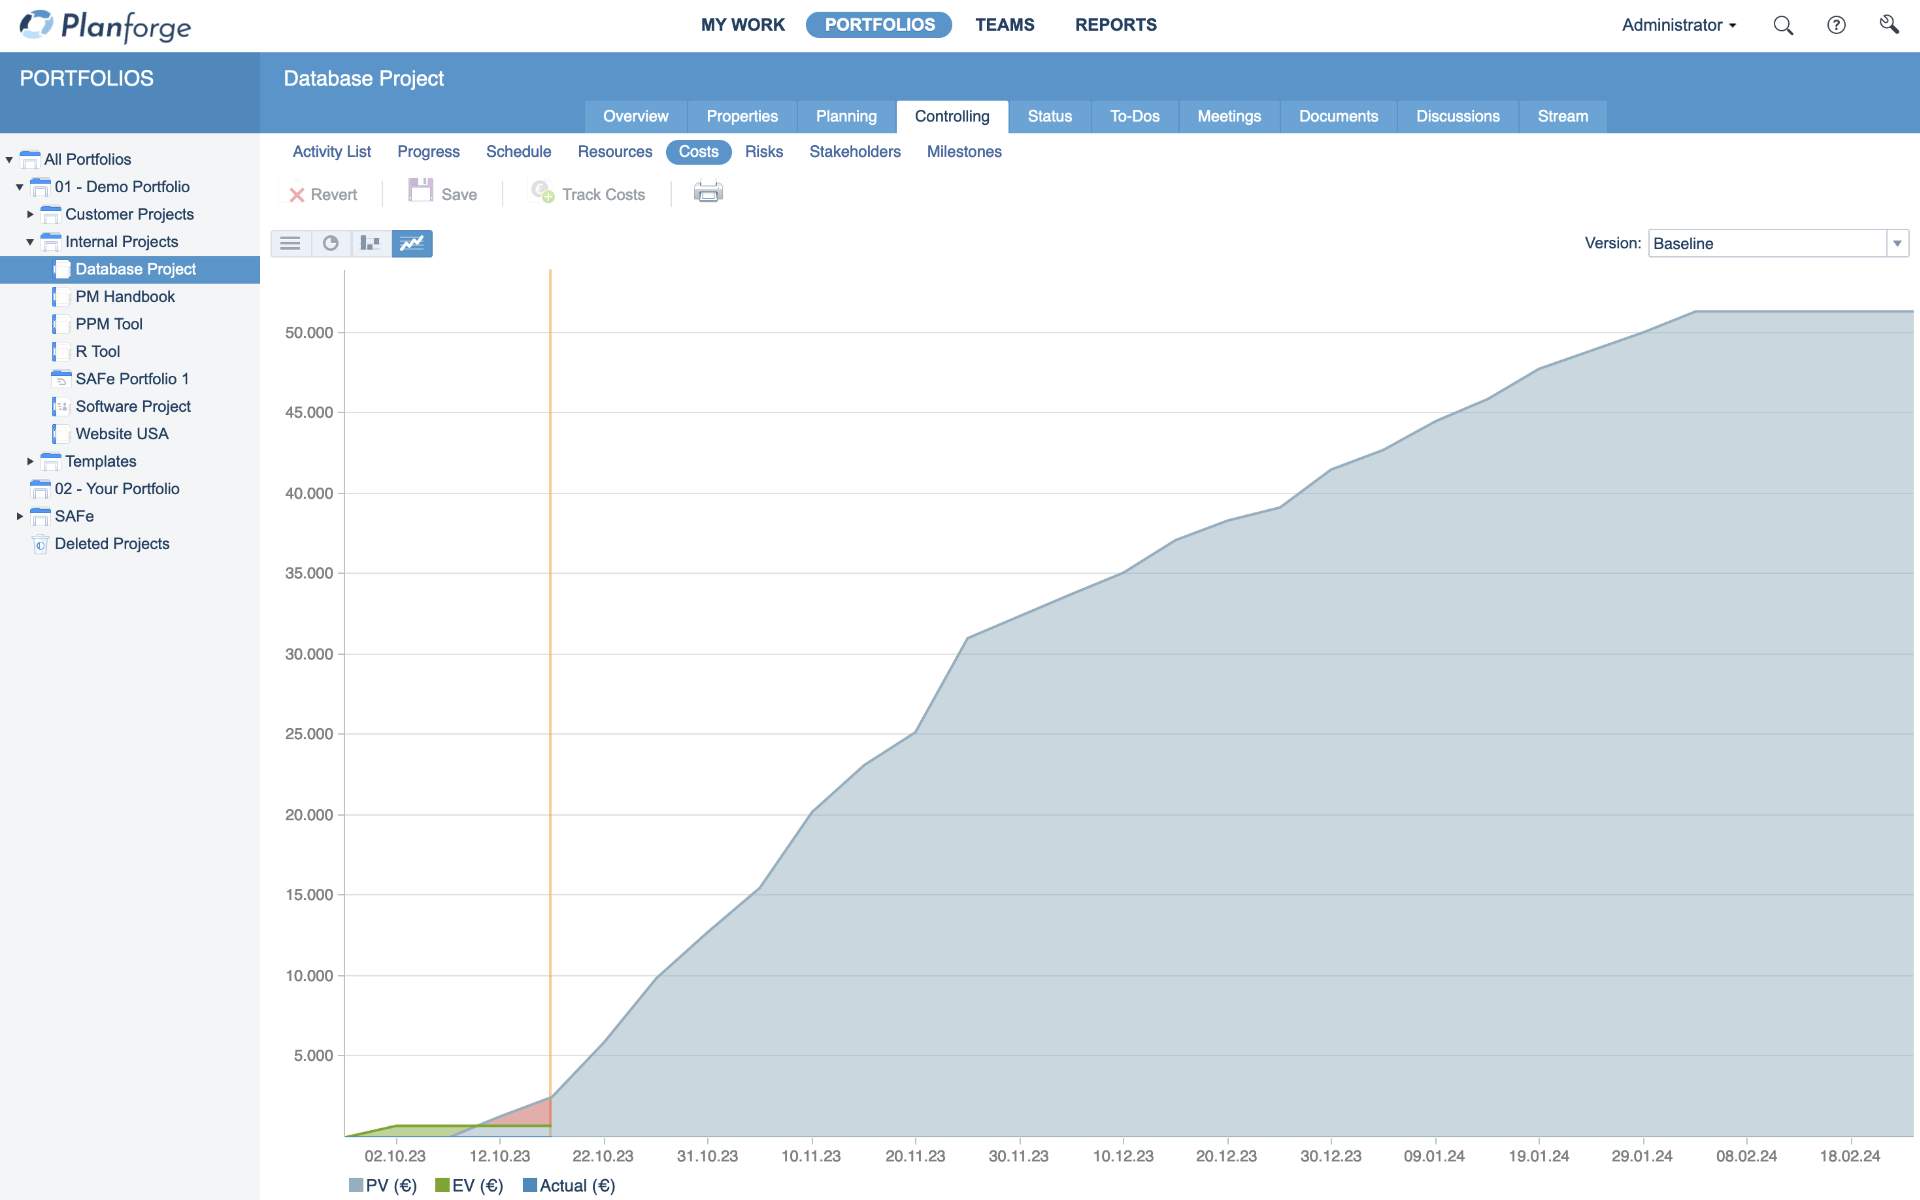
PM tools display the Earned Value Analysis for each activity and the entire project — without manual calculations. You can see this in the example in the following figure.
Not that complicated and a very good tool to visualize the progress of your project over time, isn’t it?
8. Limits of the Earned Value Method
It does not consider other important aspects of a project, such as quality or risks
The percentage of completion variable often cannot be estimated 100% correctly
8.1 Solutions to calculate the percentage of completion
There is always a risk of misestimating the percentage of completion. You can limit that risk using the following approaches:
The 0/100 method:
Only completed (100%) activities are taken into the calculation. The activity is considered 0% complete until all the work has been finished. This method is often used if the results of the activities are uncertain. (Example)
The 50/50 method:
If an activity has already started, it is always calculated with 50%. The remaining 50% of the activity are assigned after its completion. This method is well suited for small projects.
The 20/80 method:
The percentages can be modified as needed (25%/75%, etc.). It is the most used approach for the calculation. You can include the smaller percentage for an activity (20, 25...) into the calculation, and only after the activity is completed is the rest considered done.
A project management software can minimize calculation mistakes because it includes all project indicators in real-time. Progress rates are already available as metrics without any calculations needed.
Contact us if you want to support your project management with a modern, hybrid PPM software.


 Jira
Jira
 Confluence
 SAP
SAP
 API
API


